Musical Roses
The code behind drawing roses with music
Musical Roses
Alright, so I built this thing where a rose draws itself to the beat of your favorite song. Yeah, I know, sounds unnecessarily complicated. But why not?
It started as a "what if I could..." project. You know those ideas that hit you at 2 AM and you just have to build? This was one of those.
What if the drawing speed pulses with the bass? What if the rose grows faster during the drops and slows down during the verses? What if it's not just a video, but a collaboration between the song and the code?
Music, Math, and Why I Can't Stop Combining Them
If you've seen my 52 Weeks of Colors project, you already know I'm obsessed with visualizing music. There's something magical about translating sound into something you can see. Not just listen, but visualize.
Music is already mathematical. It always has been. Frequencies, wavelengths, harmonics, beats per minute. The entire foundation of music is math dressed up in emotion.
So combining music with mathematical curves? It makes sense. It's just two things I love, hanging out together.
The Mathematics of Rose Curves
Rose curves (or rhodonea curves, if you want to sound fancy) have been fascinating mathematicians for centuries. They're sinusoidal curves in polar coordinates, and when you plot them, they look exactly like flowers. The petals aren't added on, they emerge naturally from the equation.
The Fundamental Equation
Let's break down what each variable does:
| Variable | Name | Effect |
|---|---|---|
| r | Radius | Distance from origin (the center) |
| θ | Angle | The position around the circle (0 to 2π) |
| n | Amplitude | Overall size of the rose |
| k | Frequency | Number of petals |
| φ | Phase | Rotation offset |
When you vary θ from 0 to 2π, r oscillates between positive and negative values. That's how petals form.
Petal Count: The Beautiful Integer Problem
Here's where it gets interesting. The number of petals depends on whether k is odd or even:
So:
- k = 5 → 5 petals
- k = 7 → 7 petals
- k = 6 → 12 petals
But what if k is a fraction? Like k = 5.5? The rose never closes. It keeps drawing forever, denser and denser, never repeating. Beautiful chaos.
In my code, I used k ≈ 5 with slight variations:
1const k = baseK + Math.sin(i * 0.5) * 0.8;
So k varies between approximately 4.2 and 5.8. Each layer has a slightly different petal structure, which creates that natural, organic look.
Converting to Cartesian Coordinates
The canvas needs (x, y) coordinates, not polar. The conversion is:
Substituting r from our rose equation:
Where (x₀, y₀) is the center of the canvas.
The Area of a Single Petal
If you're wondering how much "space" one petal takes up (mathematically speaking):
Using the identity KaTeX can only parse string typed expression:
For a unit rose (n = 1) with k = 5:
Each petal has an area of π/20. The entire rose has area 5π/20 = π/4.
The Layering Strategy
One rose curve looks... flat. Like a mathematical abstraction. I wanted something that looked like an actual flower. Something with depth, so I made a rose with 30 layers.
1234567891011121314151617181920const numLayers = 30;
const baseK = 5;

for (let i = 0; i < numLayers; i++) {
    const progress = i / numLayers;

    // Size increases with each layer (outer layers are bigger)
    const n = (i + 1) * 7.5 * scaleFactor;

    // k varies slightly for natural look
    const k = baseK + Math.sin(i * 0.5) * 0.8;

    // Phase rotation creates petal distribution
    const y = (i * Math.PI * 0.15);

    // Color gradient from center to edge
    const hue = 340;
    const saturation = 85 - progress * 25;
    const lightness = 25 + progress * 45;
}
Why This Works
-
Size progression: Each layer is bigger than the last. Outer layers form the outer petals, inner layers form the center.
-
Phase rotation: The
yparameter (phase) rotates each layer by about 8.6° (π/15 radians). Over 30 layers, this creates a full rotation distribution, so petals overlap naturally. -
Color gradient: Inner layers are deep pink (saturation 85%, lightness 25%). Outer layers are pale pink (saturation 60%, lightness 70%). This mimics real roses, where the center is often more intense.
Visual Depth Through Z-Index
1layers.sort((a, b) => a.zIndex - b.zIndex);
Outer layers draw first, inner layers draw on top. This creates the illusion that you're looking into the rose, not just at a flat shape.
The Audio Analysis Pipeline
This is the part that makes it feel alive.
Web Audio API Basics
The Web Audio API is honestly one of the most underrated browser APIs. You create an AudioContext, connect an audio source to an AnalyserNode, and suddenly you have real-time frequency data.
123456789const audioContext = new (window.AudioContext || (window as any).webkitAudioContext)();

const analyser = audioContext.createAnalyser();
const source = audioContext.createMediaElementSource(audio);

source.connect(analyser);
analyser.connect(audioContext.destination);

analyser.fftSize = 1024;
FFT: Fast Fourier Transform
Audio starts as a waveform (amplitude over time). FFT (Fast Fourier Transform) converts this into frequency data. Instead of "what's the loudness right now?", You get the map of frequencies and their intensities.
With fftSize = 1024, we get 512 frequency bins. Each bin represents a frequency range:
For a 48kHz audio sample, each bin is about 23.4 Hz wide. The first bin is 0-23 Hz, second is 23-47 Hz, etc.
Frequency Band Division
The human hearing range gets divided into three musical categories:
- Bass: 0 - 300 Hz (kick drums, bass guitars - hits you in the chest)
- Mid: 300 - 4000 Hz (vocals, guitars, most instruments)
- Treble: 4000 - 20000 Hz (hi-hats, cymbals - airy, light sounds)
In code terms:
123456const bassRange = dataArray.slice(0, Math.floor(bufferLength * 0.15));
const midRange = dataArray.slice(
    Math.floor(bufferLength * 0.15),
    Math.floor(bufferLength * 0.5)
);
const trebleRange = dataArray.slice(Math.floor(bufferLength * 0.5));
Calculating Band Intensities
Each band is normalized to [0, 1]:
Why divide by 255? Because Uint8Array stores values 0-255. We want a normalized value where 1.0 = maximum possible intensity.
123const avgBass = bassRange.reduce((a, b) => a + b, 0) / bassRange.length / 255;
const avgMid = midRange.reduce((a, b) => a + b, 0) / midRange.length / 255;
const avgTreble = trebleRange.reduce((a, b) => a + b, 0) / trebleRange.length / 255;
The Music-Reactive Drawing Speed
Here's where the magic happens. The drawing speed isn't constant. It pulses with the music.
The Speed Formula
Let S be the number of points to draw in a frame:
Where M combines the musical components:
In code terms:
12345678910111213141516171819// How much each band affects this layer
const bassInfluence = 1 - progress;        // Inner layers = more bass
const trebleInfluence = progress;          // Outer layers = more treble

const baseMusicalSpeed = (
    bass * bassInfluence * 1.5 +     // Bass weighted more
    treble * trebleInfluence * 1.2 + // Treble weighted moderately
    mid * 0.8                         // Mid has base influence
);

const energyMultiplier = 1 + energy * 0.1;
const peakMultiplier = 1 + peak * 0.2;

const finalSpeed = (
    layer.baseSpeed *
    baseMusicalSpeed *
    energyMultiplier *
    peakMultiplier
) * 0.4;
Peak Detection
Some moments in songs are intense. We detect these:
12const maxBass = Math.max(...bassRange) / 255;
const peakDetection = maxBass > 0.7 ? maxBass : 0;
Only when bass exceeds 70% of maximum do we apply the peak multiplier. This creates those "spikes" where the drawing suddenly accelerates.
The Complete Animation Loop
1234567891011121314151617181920212223242526272829303132333435function animate() {
    if (currentLayerIndex >= layers.length) {
        setCompleted(true);
        return;
    }

    const { bass, mid, treble, energy, peak } = getAudioFeatures();

    const pointsToDrawThisFrame = calculateSpeed(bass, mid, treble, energy, peak);

    // Draw points
    for (let j = 0; j < pointsToDrawThisFrame; j++) {
        if (layer.drawn < layer.points.length - 1) {
            const p1 = layer.points[layer.drawn];
            const p2 = layer.points[layer.drawn + 1];

            ctx.beginPath();
            ctx.moveTo(p1.x, p1.y);
            ctx.lineTo(p2.x, p2.y);
            ctx.stroke();

            layer.drawn++;
        } else {
            currentLayerIndex++;
            break;
        }
    }

    // Update progress
    const totalPoints = layers.reduce((sum, l) => sum + l.points.length, 0);
    const drawnPoints = layers.reduce((sum, l) => sum + l.drawn, 0);
    setProgress(Math.round((drawnPoints / totalPoints) * 100));

    animationFrameRef.current = requestAnimationFrame(animate);
}
Extensions and Experiments
More Petals
Change the baseK value:
123const baseK = 7;  // 7 petals
// or
const baseK = 8;  // 16 petals
Different Color Schemes
12345const hue = 200;  // Blue rose
// or
const hue = 45;   // Gold rose
// or
const hue = 280;  // Purple rose
Multiple Roses
Create a bouquet by rendering multiple canvases with different centers and colors.
The Code
I haven't open-sourced this yet, but lemme give a brief overview.
React hooks manage state. Canvas API does the drawing. Web Audio API does the listening. Rose curves provide the math.
Sometimes the best projects are the ones that don't have a practical purpose. They just exist because you wanted to see if they could.
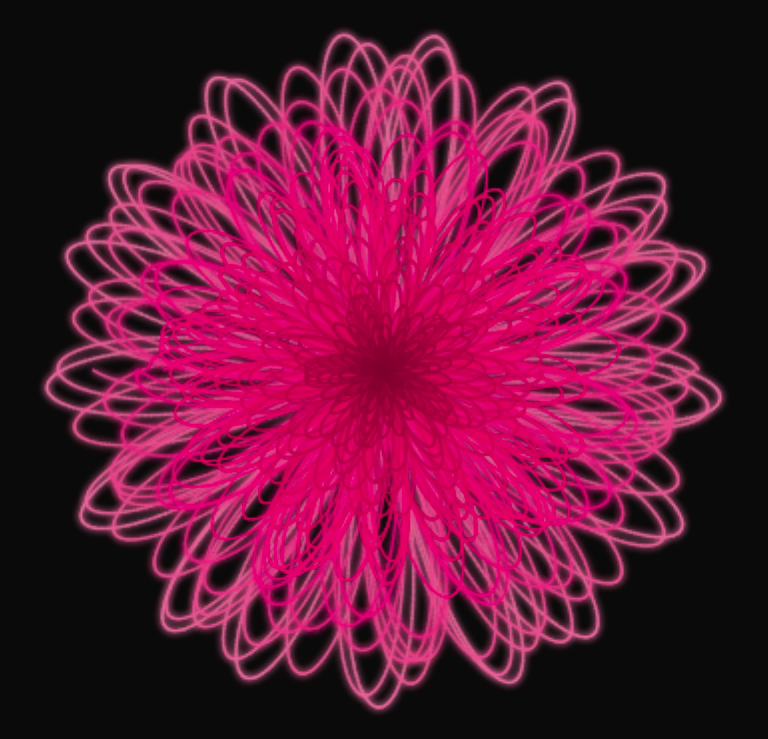
Final Outcome
This is outcome of one of my experiment, I'm still optimising the code to make the final outcome look more like a rose than just a collection of random strokes.
Final Thoughts
In the end I just want to say that gift real roses over artificial ones. But why not both?